Note: This article was originally published in 2011. Some steps, commands, or software versions may have changed. Check the current Content Providers documentation for the latest information.
In this step-by-step guide, you’ll learn obtain stock quotes from yahoo finance (you can query them via excel too).
How to obtain stock quotes in Excel
| I was working on creating a spreadsheet to calculate profits and losses on options positions but didn’t know how to populate excel with stock quotes. Back in the day there used to be an interface to get stock quotes with the (http://moneycentral.msn.com “MSN Money”) site but it is not supported anymore. The idea behind this spreadsheet was to use the latest and historic quotes to calculate intrinsic values of options and P&L for expired ones. Kind of just trying to keep track of my record and evaluate performance. Of course the issue we face is that stock prices move every second and maintaining all that data manually is not worth it. After some research I tried using (http://www.google.com/finance “Google Finance”) to populate Excel to no avail but found (http://m.www.yahoo.com/ “Yahoo! Finance”) supports this more easily. In order to query stock quotes from yahoo all you need to do is use the following URL and provide the required parameters: http://finance.yahoo.com/d/quotes.csv?s=_{(http://en.wikipedia.org/wiki/Ticker_symbol “Ticker symbol”) separated by the ’+’ character}_****& f={letters which represent a column of information you wish to be provided} Keep in mind you need to use the Excel feature of “External data source” under the “Data section”. There you’ll find the option for “HTML” or similar. I use Excel for Mac in spanish so the names might be slightly different in the PC version. So really there are 2 pieces of information you provide via the URL to get your stock quotes. First the list of stocks you wish to get a quote on separated by a ’+’ sign like ‘GS+BAC+(http://www.google.com/finance?q=NASDAQ:MSFT “NASDAQ: MSFT”)+(http://www.google.com/finance?q=NASDAQ:AAPL “NASDAQ: AAPL”)’ etc. The second part are the columns of information you wish to be provided like the last quoted price, the symbol, the full name, and much more. Below is a table with all the different columns you may request back as part of the csv: a | Ask | a2 | (http://www.wikinvest.com/metric/Average_Volume “Average Volume”) | a5 | Ask Size |
|---|---|---|---|---|---|
| b | Bid | b2 | Ask (Real-time) | b3 | Bid (Real-time) |
| b4 | (http://www.wikinvest.com/metric/Book_Value “Book Value”) | b6 | Bid Size | c | Change & Percent Change |
| c1 | Change | c3 | Commission | c6 | Change (Real-time) |
| c8 | After Hours Change (Real-time) | d | Dividend/Share | d1 | Last Trade Date |
| d2 | Trade Date | e | Earnings/Share | e1 | Error Indication (returned for symbol changed / invalid) |
| e7 | EPS Estimate Current Year | e8 | EPS Estimate Next Year | e9 | EPS Estimate Next Quarter |
| f6 | Float Shares | g | Day’s Low | h | Day’s High |
| j | (http://www.wikinvest.com/metric/52_Week_Low “52 Week Low”) | k | (http://www.wikinvest.com/metric/52_Week_High “52 Week High”) | g1 | Holdings Gain Percent |
| g3 | Annualized Gain | g4 | Holdings Gain | g5 | Holdings Gain Percent (Real-time) |
| g6 | Holdings Gain (Real-time) | i | More Info | i5 | Order Book (Real-time) |
| j1 | Market Capitalization | j3 | Market Cap (Real-time) | j4 | EBITDA |
| j5 | Change From 52-week Low | j6 | Percent Change From 52-week Low | k1 | Last Trade (Real-time) With Time |
| k2 | Change Percent (Real-time) | k3 | Last Trade Size | k4 | Change From 52-week High |
| k5 | Percebt Change From 52-week High | l | Last Trade (With Time) | l1 | Last Trade (Price Only) |
| l2 | High Limit | l3 | Low Limit | m | Day’s Range |
| m2 | Day’s Range (Real-time) | m3 | 50-day Moving Average | m4 | 200-day Moving Average |
| m5 | Change From 200-day Moving Average | m6 | Percent Change From 200-day Moving Average | m7 | Change From 50-day Moving Average |
| m8 | Percent Change From 50-day Moving Average | n | Name | n4 | Notes |
| o | Open | p | Previous Close | p1 | Price Paid |
| p2 | Change in Percent | p5 | Price/Sales | p6 | Price/Book |
| q | Ex-Dividend Date | r | P/E Ratio | r1 | Dividend Pay Date |
| r2 | P/E Ratio (Real-time) | r5 | PEG Ratio | r6 | Price/EPS Estimate Current Year |
| r7 | Price/EPS Estimate Next Year | s | Symbol | s1 | Shares Owned |
| s7 | Short Ratio | t1 | Last Trade Time | t6 | Trade Links |
| t7 | Ticker Trend | t8 | 1 yr Target Price | v | Volume |
| v1 | Holdings Value | v7 | Holdings Value (Real-time) | w | 52-week Range |
| w1 | Day’s Value Change | w4 | Day’s Value Change (Real-time) | x | Stock Exchange |
| y | Dividend Yield | ||||
| In my case this was a very simple query in which all I needed was the stock symbol and the last quoted price so I can do a vlookup and plug in the required price in my calculations. The URL I used looks somewhat like this (you can click it to see the resulting data set): (http://finance.yahoo.com/d/quotes.csv?s=bac+bp+c+msft+aapl&f=sl1) This downloads a CSV into your browser but if you put it in as a file connection in excel you’re able to populate a sheet with your stock quotes and then just run a vlookup against it for any information you need. |
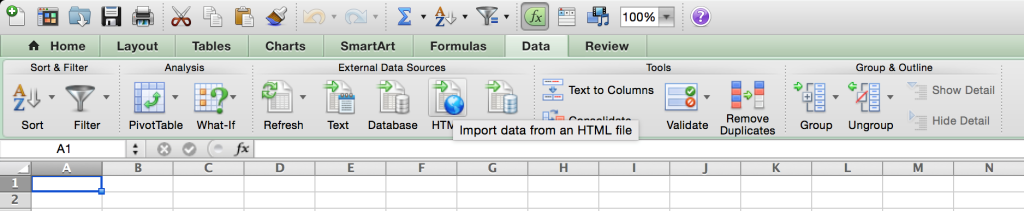
In Excel you can find the import HTML menu under Data, in the External Data Sources section. (http://kx.cloudingenium.com/wp-content/uploads/sites/3/2011/08/Kx.CloudIngenium.com-Excel-2011-Data-HTLM-Import-Screenshot-1024x211.png)](http://kx.cloudingenium.com/wp-content/uploads/sites/3/2011/08/Kx.CloudIngenium.com-Excel-2011-Data-HTLM-Import-Screenshot.png) If you can’t find that menu, you need to use the Web Query functionality. From what I see basically you need a Web Query Definition file even for the option presented above. If you need help setting up the definition file or need help accessing that option in Excel, check this post out: (http://kx.cloudingenium.com/microsoft/office/excel/excel-2011/how-to-create-web-query-files-for-use-with-excel-for-mac/). This should do the trick on a Excel 2011 for Mac.
Related: If you want to query historical closing prices, you should check out this post: (</content-providers/yahoo/yahoo-finance/how-to-obtain-historical-stock-prices-from-yahoo-finance-you-can-query-them-via-excel-too/>) If you happen to know cooler tricks or suggestions let me know!
(http://img.zemanta.com/zemified_h.png?x-id=3aa7a72a-287a-4dae-8c07-3c5b78c86b11)](http://www.zemanta.com/?px “Enhanced by Zemanta”)
Summary
You’ve successfully learned obtain stock quotes from yahoo finance (you can query them via excel too). If you run into any issues, double-check the prerequisites and ensure your Content Providers environment is properly configured.